Documentation / Alerts
One of the best use cases with sending metrics to Graphite/InfluxDB and using Grafana is creating performance alerts that will alert you when SpeedIndex, First Visual Change or other metrics regresses on your site. Grafana supports many different notification types.
I've spent a lot of time at work tuning and setting up web performance alerts and the best way so far has been to create one alert dashboard with changes in percentage and one dashboard with the history." Peter Hedenskog - Wikipedia Performance Team
You can checkout our example setup at https://dashboard.sitespeed.io/dashboard/db/alerts. They all have the change in % to the left and a historical graph to the right.
At the moment we test three URLs, and if the change is larger than 3% on all three URLs, an alert is fired. We test three URLs to make sure the change is for multiple URLs and not specific to one URL. The limit of when to fire the alert depends on how stable metrics you have (how stable is your website, do you test with proxy, how large is server instance where you run the browser etc).
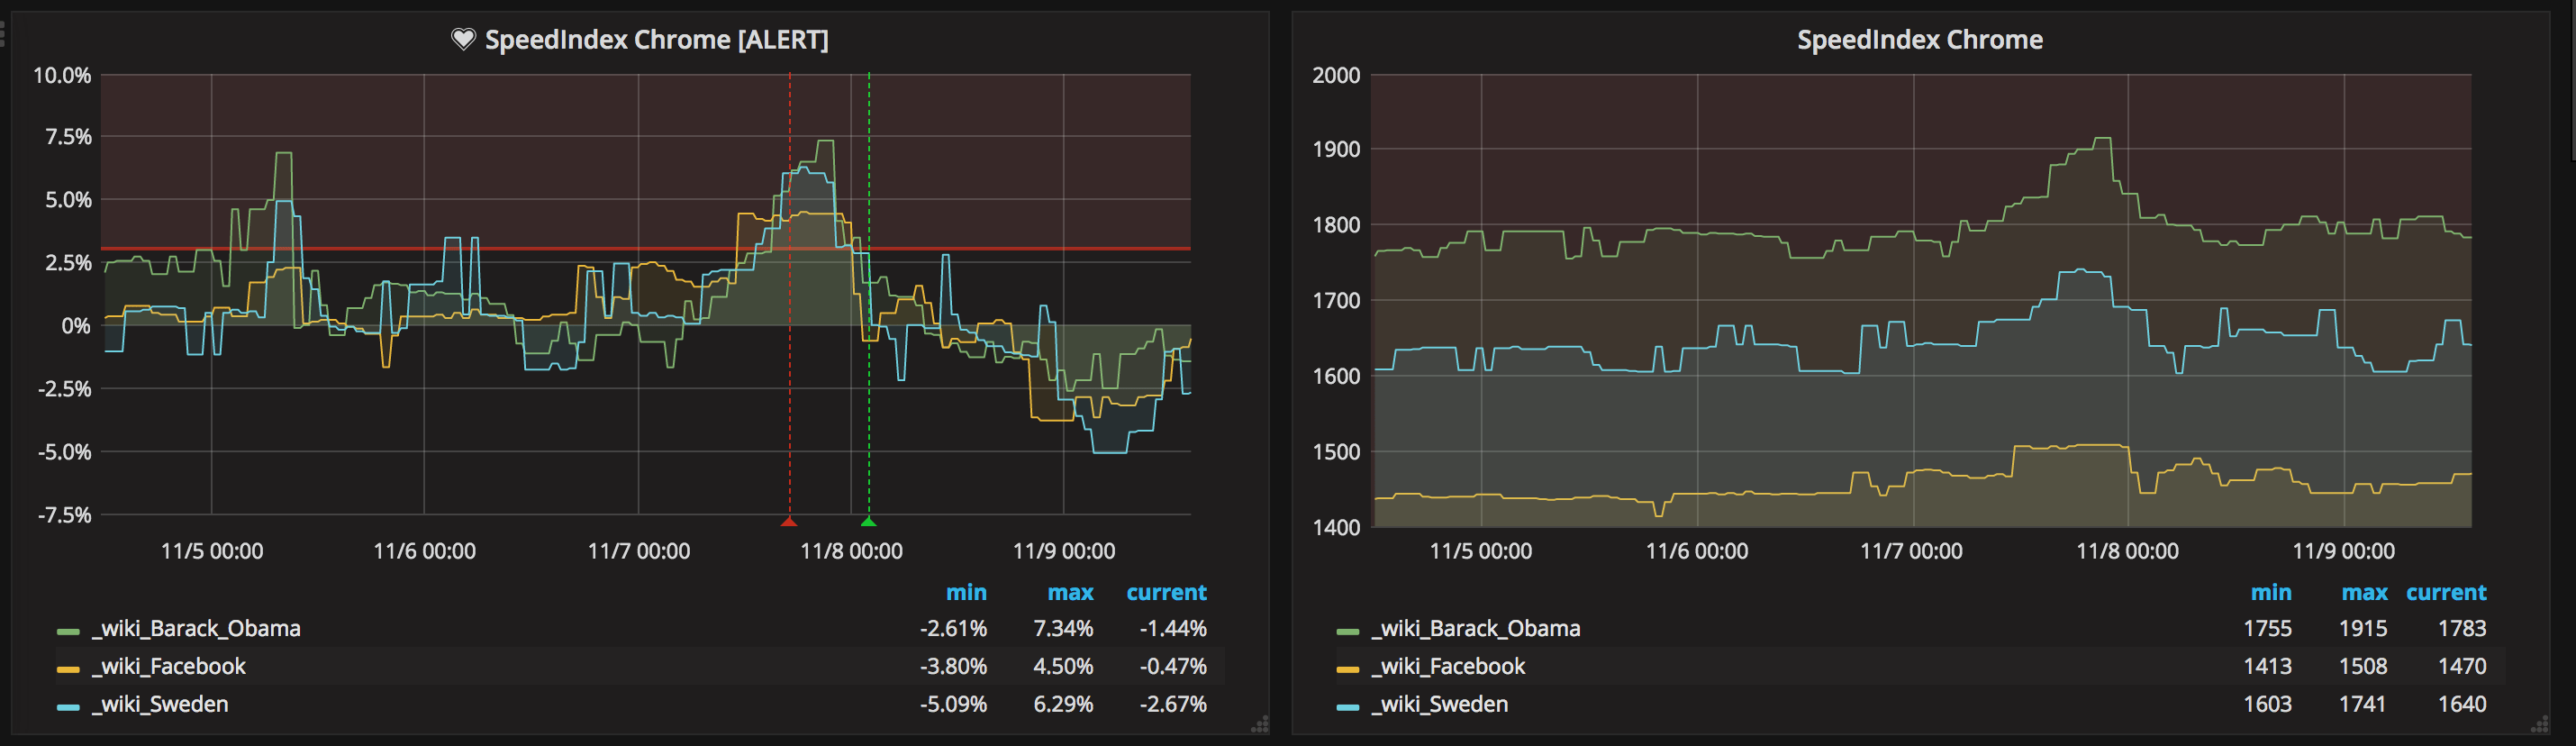
In the left part of the image you see a horizontal red line, that is when an alert is fired (sending an email/posting to Slack, PagerDuty etc). The green line is when the numbers are back to normal. In the right graph you can see the change in numbers.
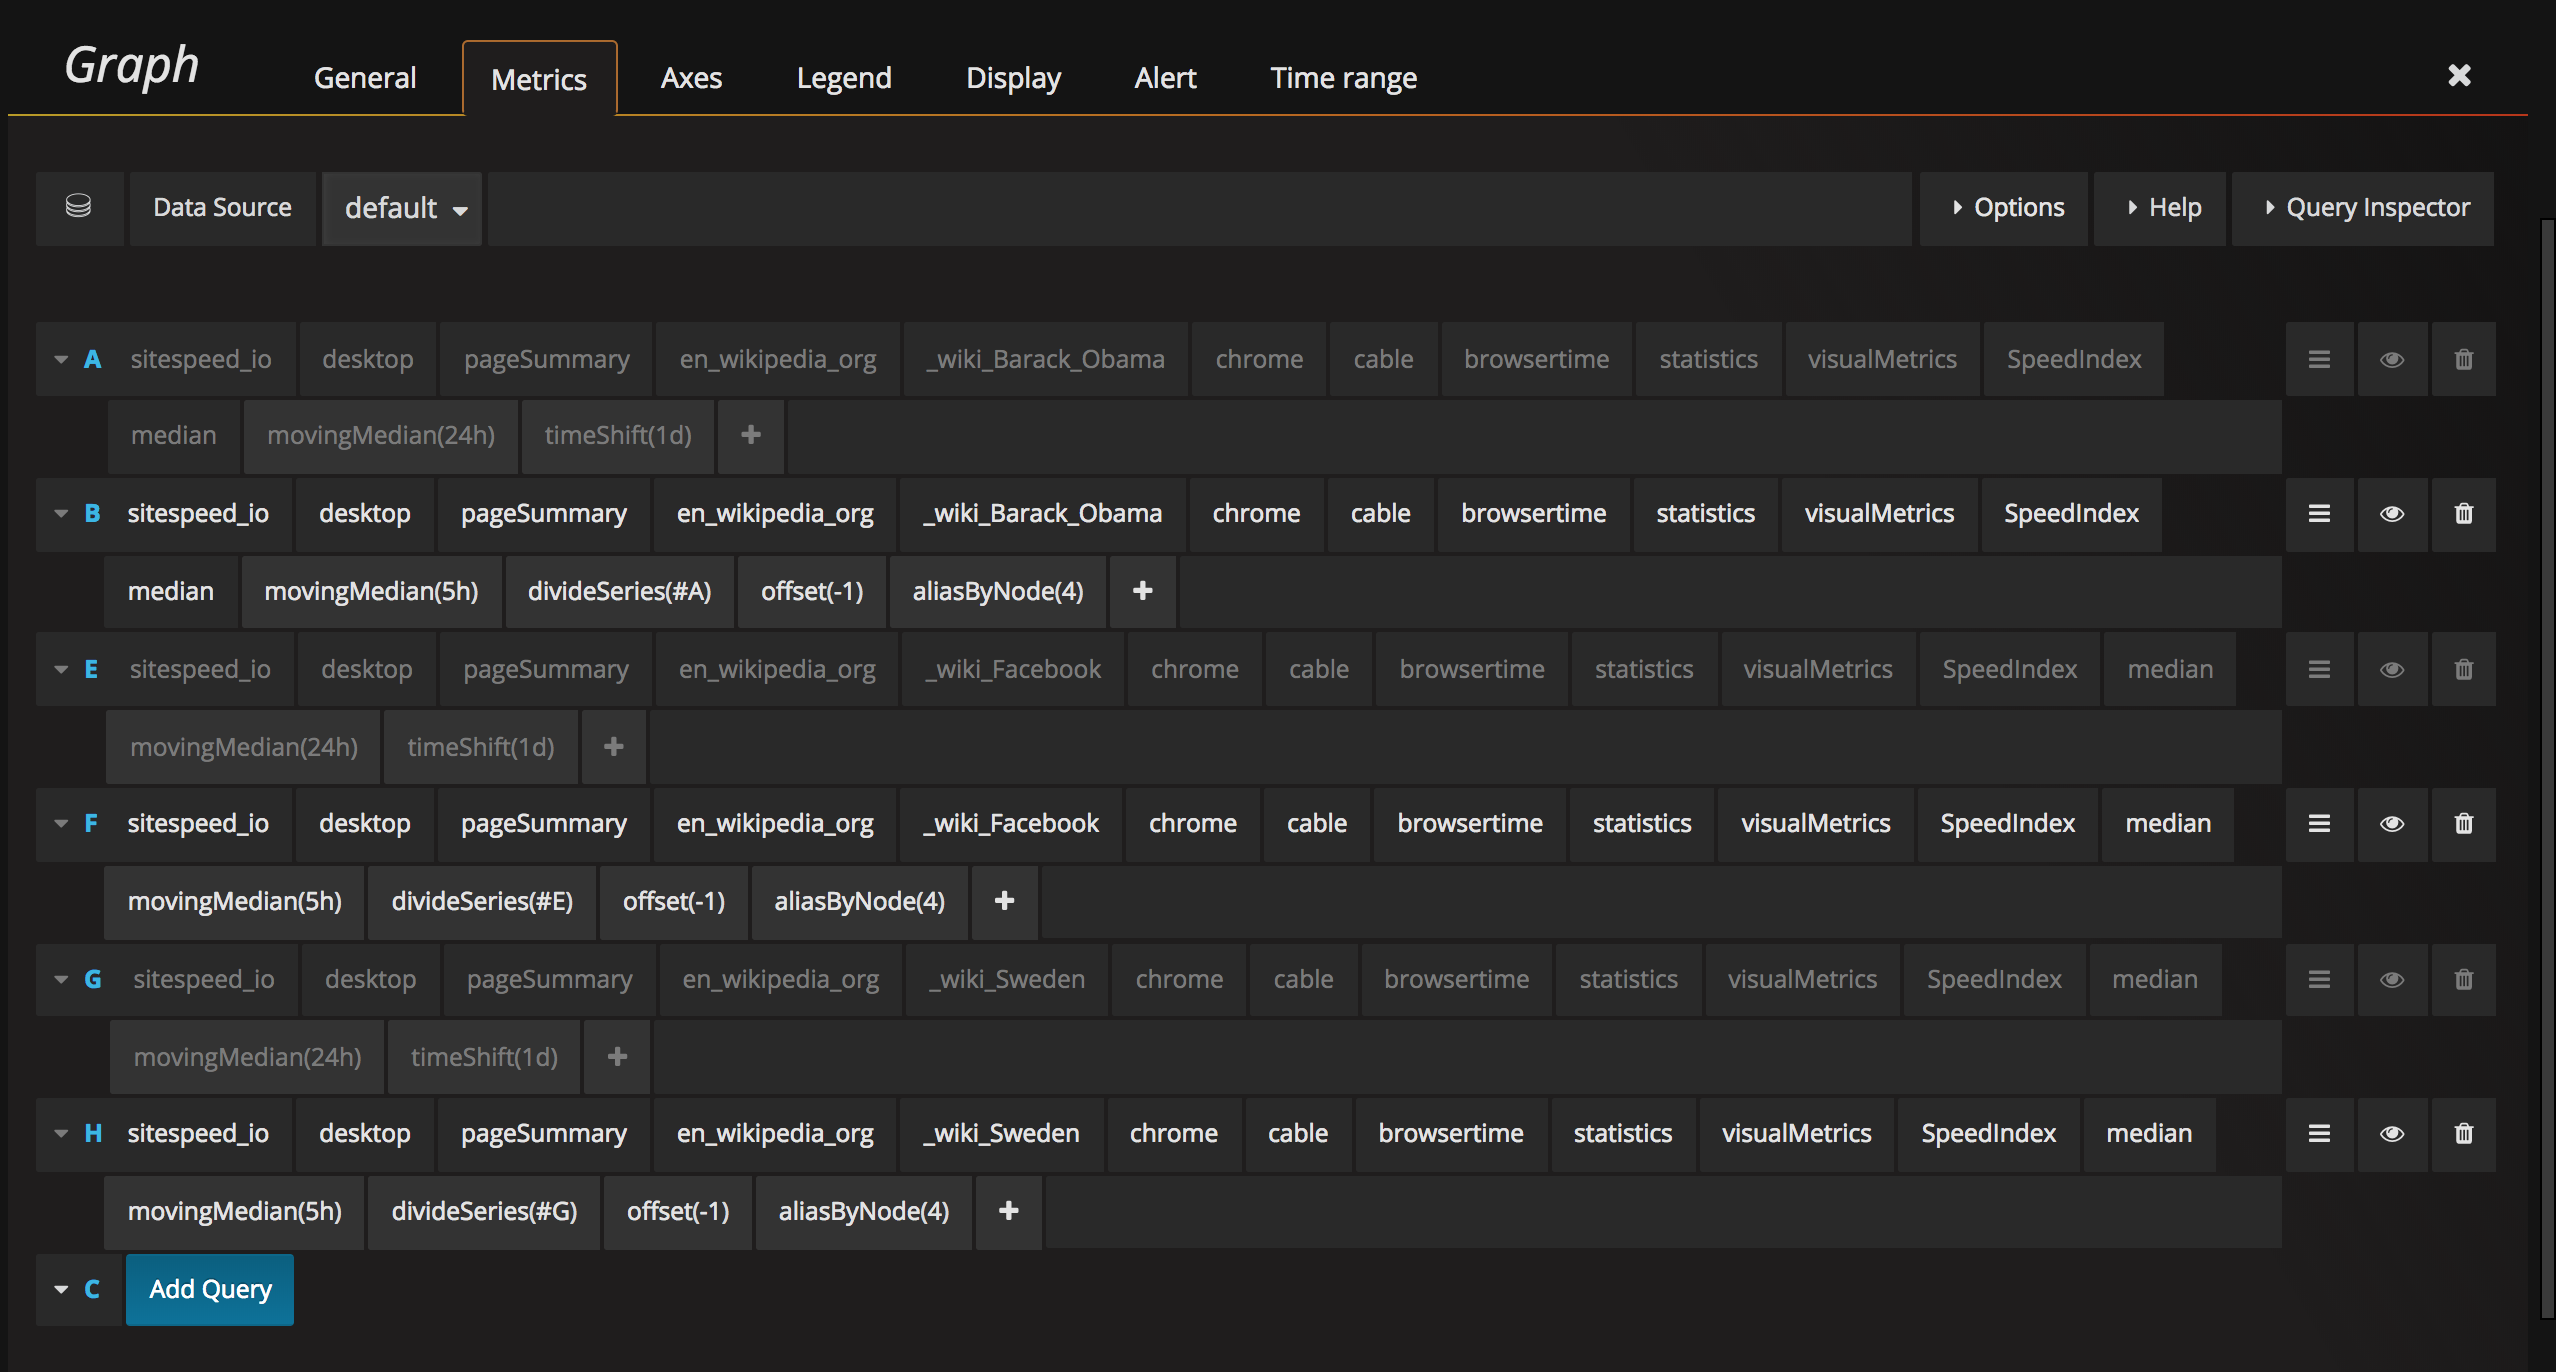
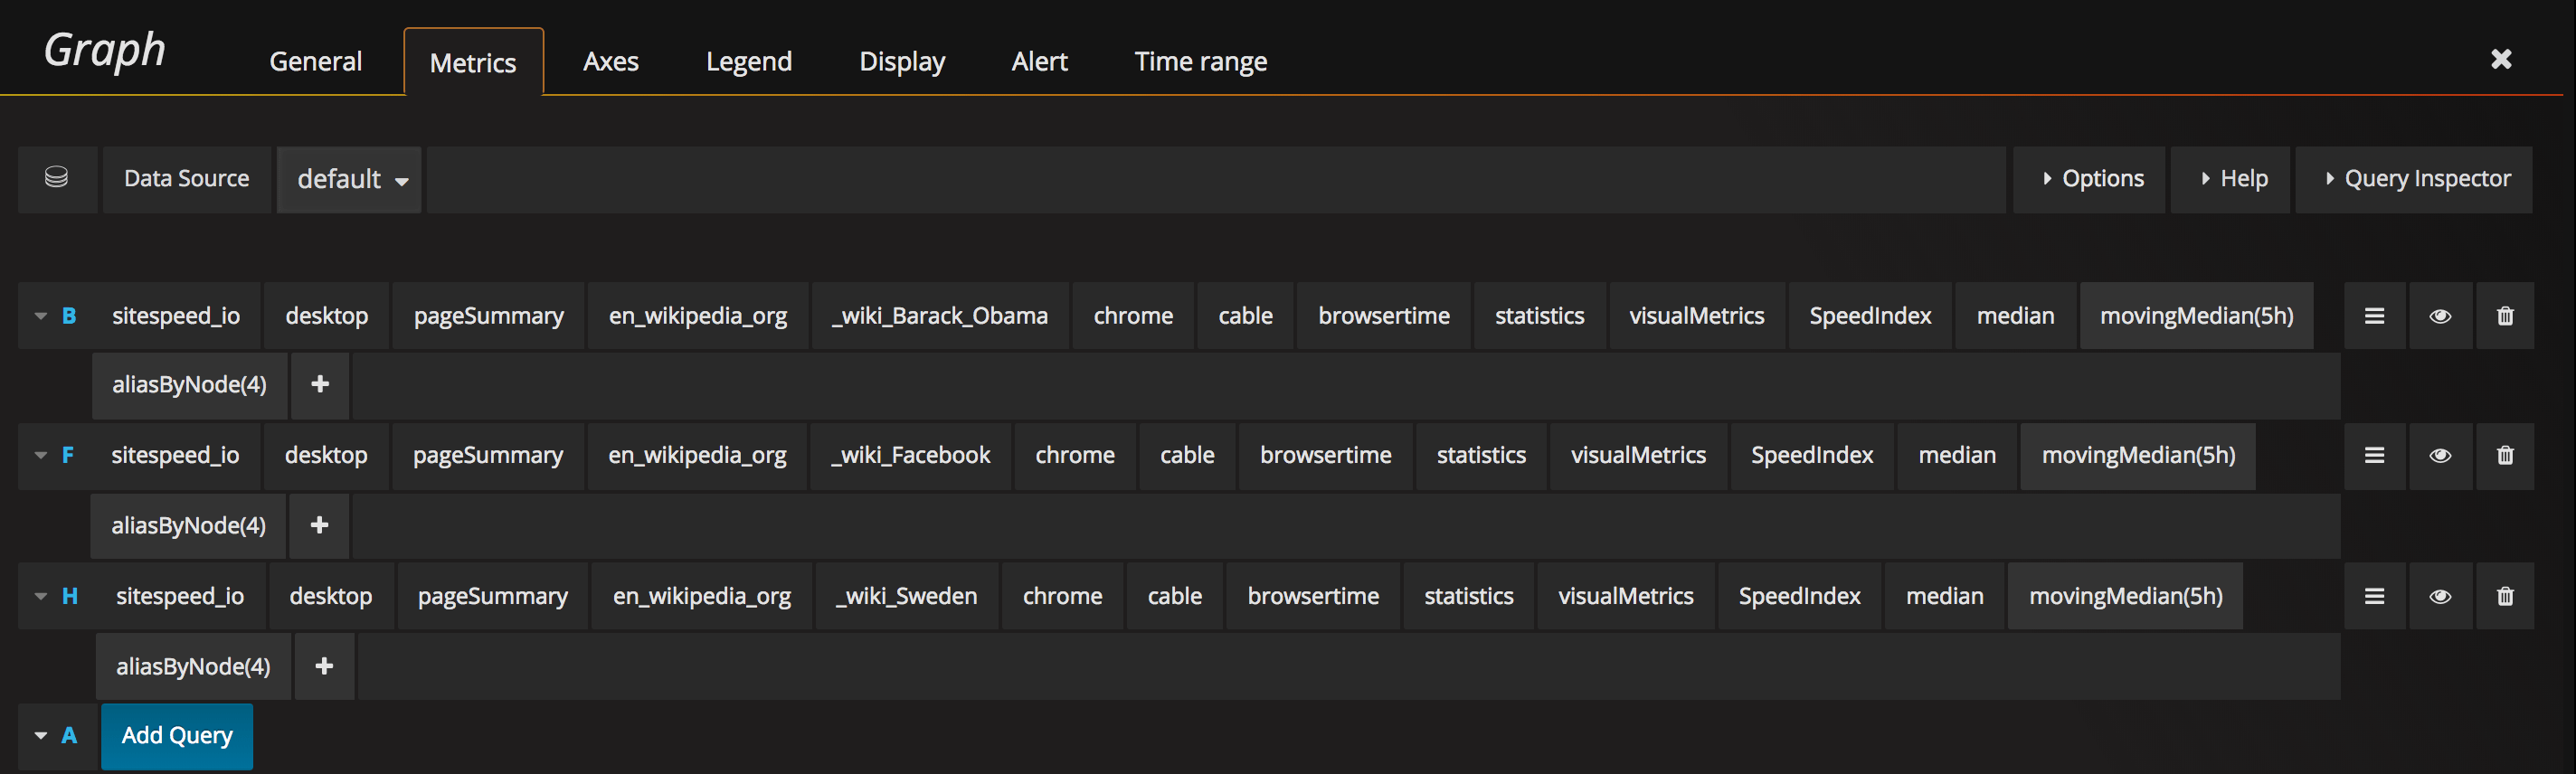
You want to create queries that measure the change in percentage over time and you want to create an alert when all of them are above a specific percentage.
To the left we have changes in percentage. These are the numbers where we add alerts. In this case we first create a query and take the moving median one day back (this is the number we will use and compare with) and then we take the moving median of the latest 5 hours. Depending on how steady metrics we have, we can do this different. If you run on a stable environment with a proxy you don’t need to take the median of X hours, instead you can take the exact run.
If you have a really unstable environment you can instead have a longer time span.
The queries for the three URLs looks like this:
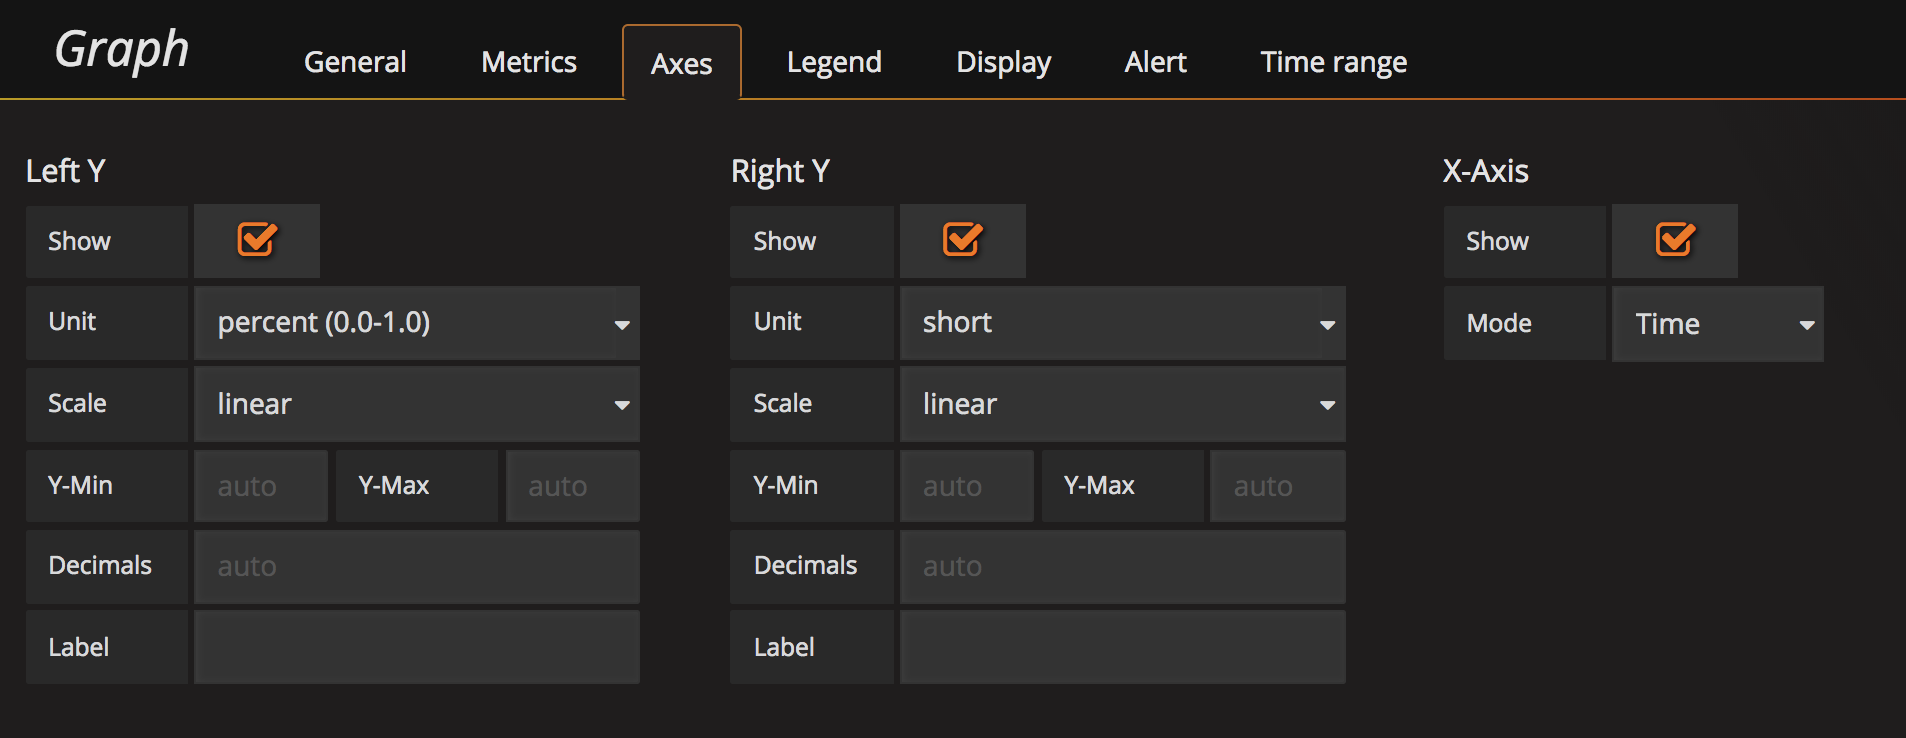
And change the axes unit to show percent: 0.0-1.0.
After that you need to create the alert. Take the median, choose a timespan and the percentage when you want to alert. In our example we do AND queries (all URLs must change) but if you are interested in specific URLs changing, you can also do OR alert queries.
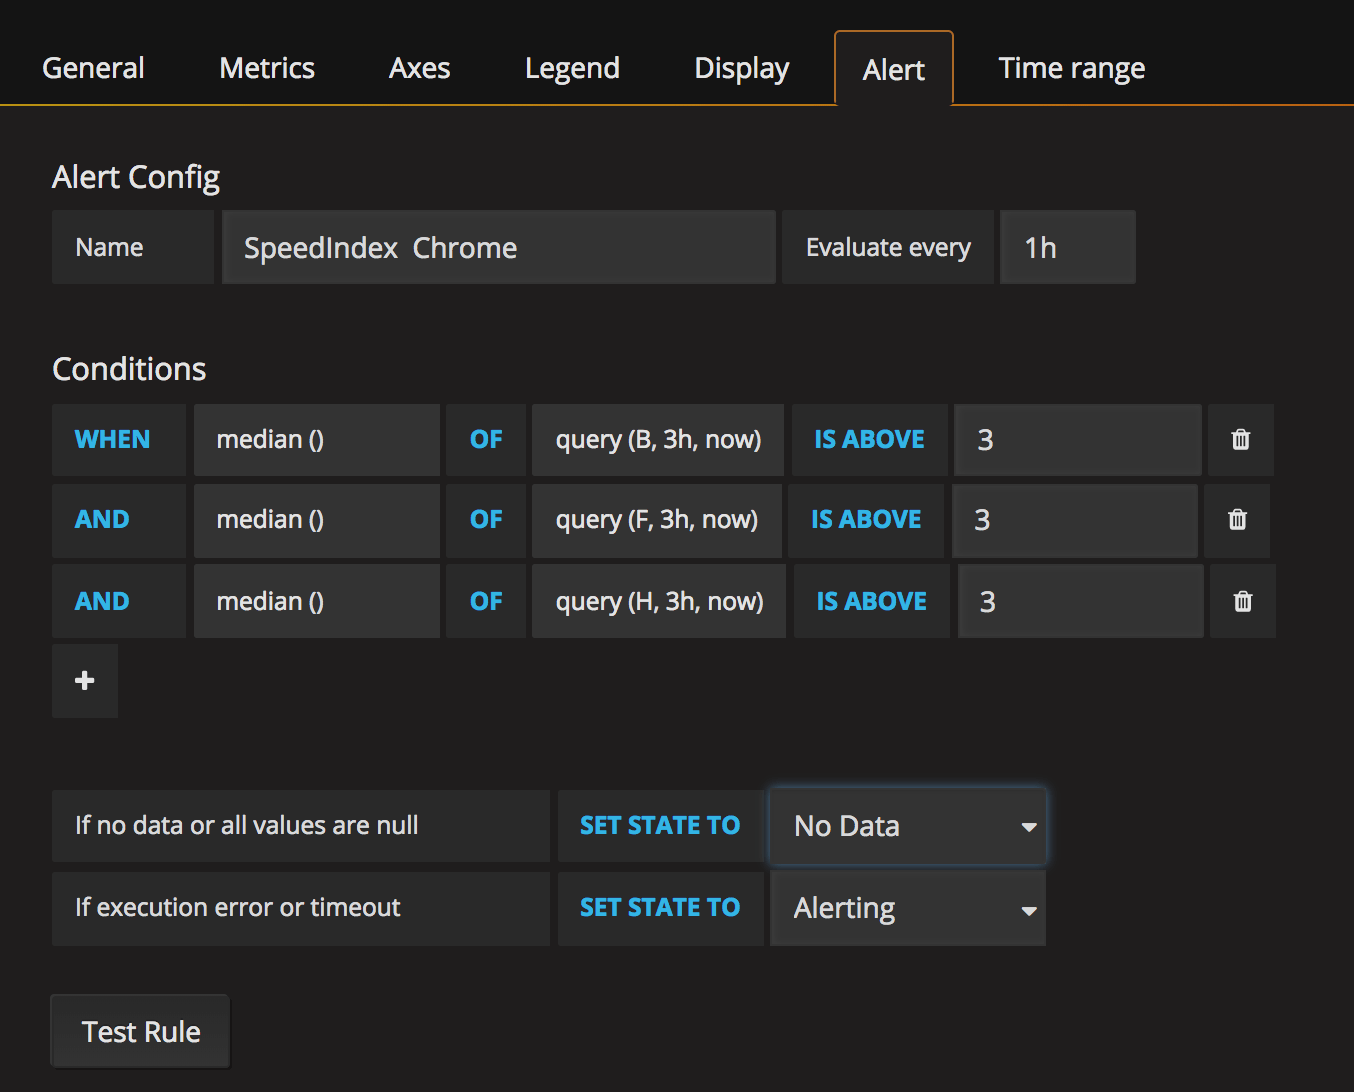
You see that we run the alerts once an hour. It depends on how often you do releases or you content changes. You want to make sure that you catch the alerts within at least couple of hours.
The history graph is pretty straight forward. You list the metrics you want and you configure how long back in time you want to graph them. We used to do 30 days (that is really good to see trends) but it was to long to see something when an actual regression was happening, now we use 7 days.
We take the moving median but you can try out what works best for you.
And then we make sure we show the last 7 days. 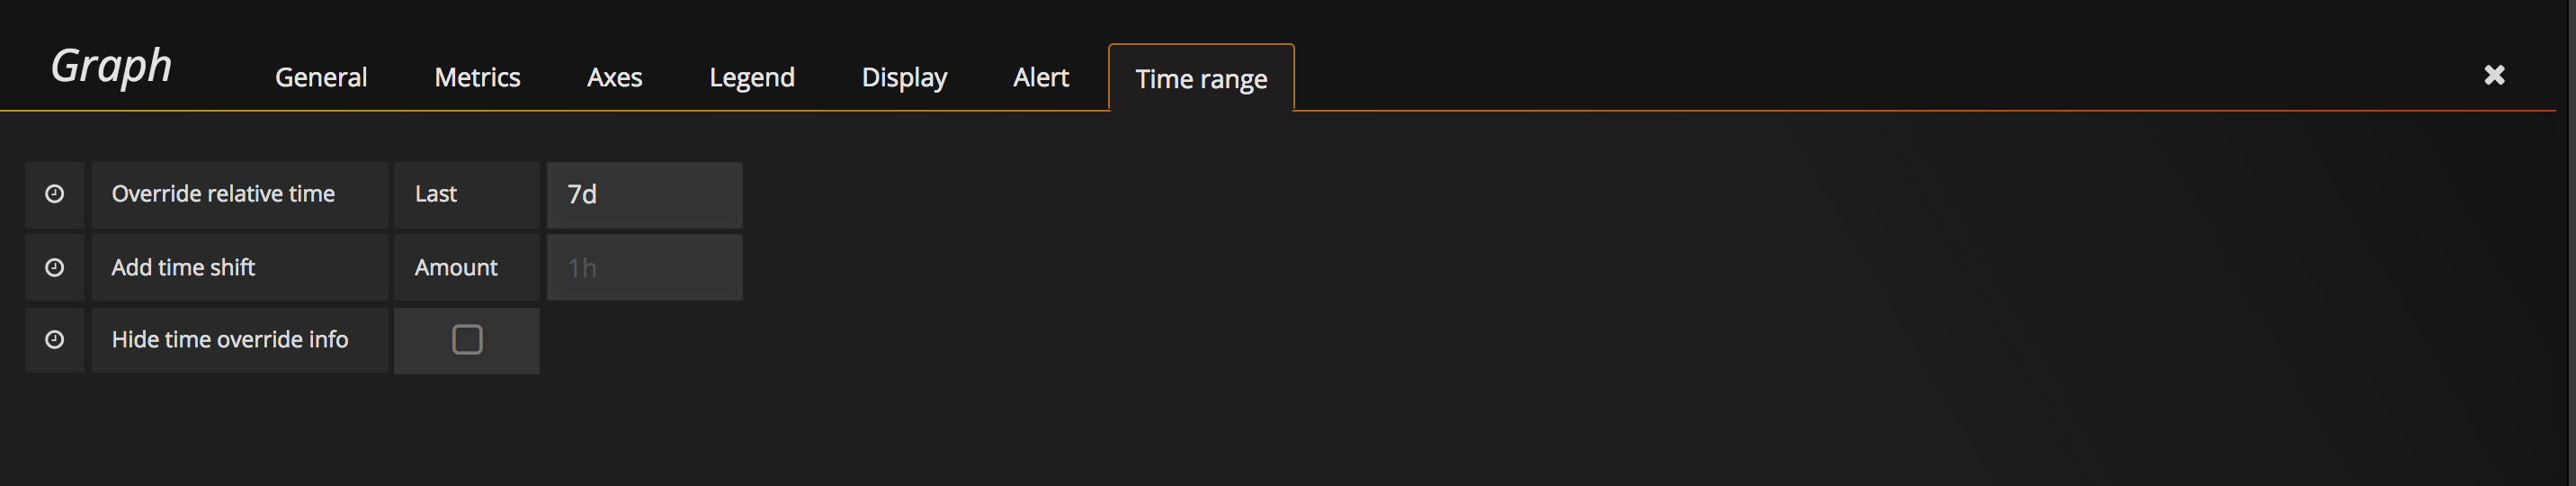
You can do the same with all the metrics you want. On mobile Wikipedia metrics is more stable and the First Visual Change looks like this:
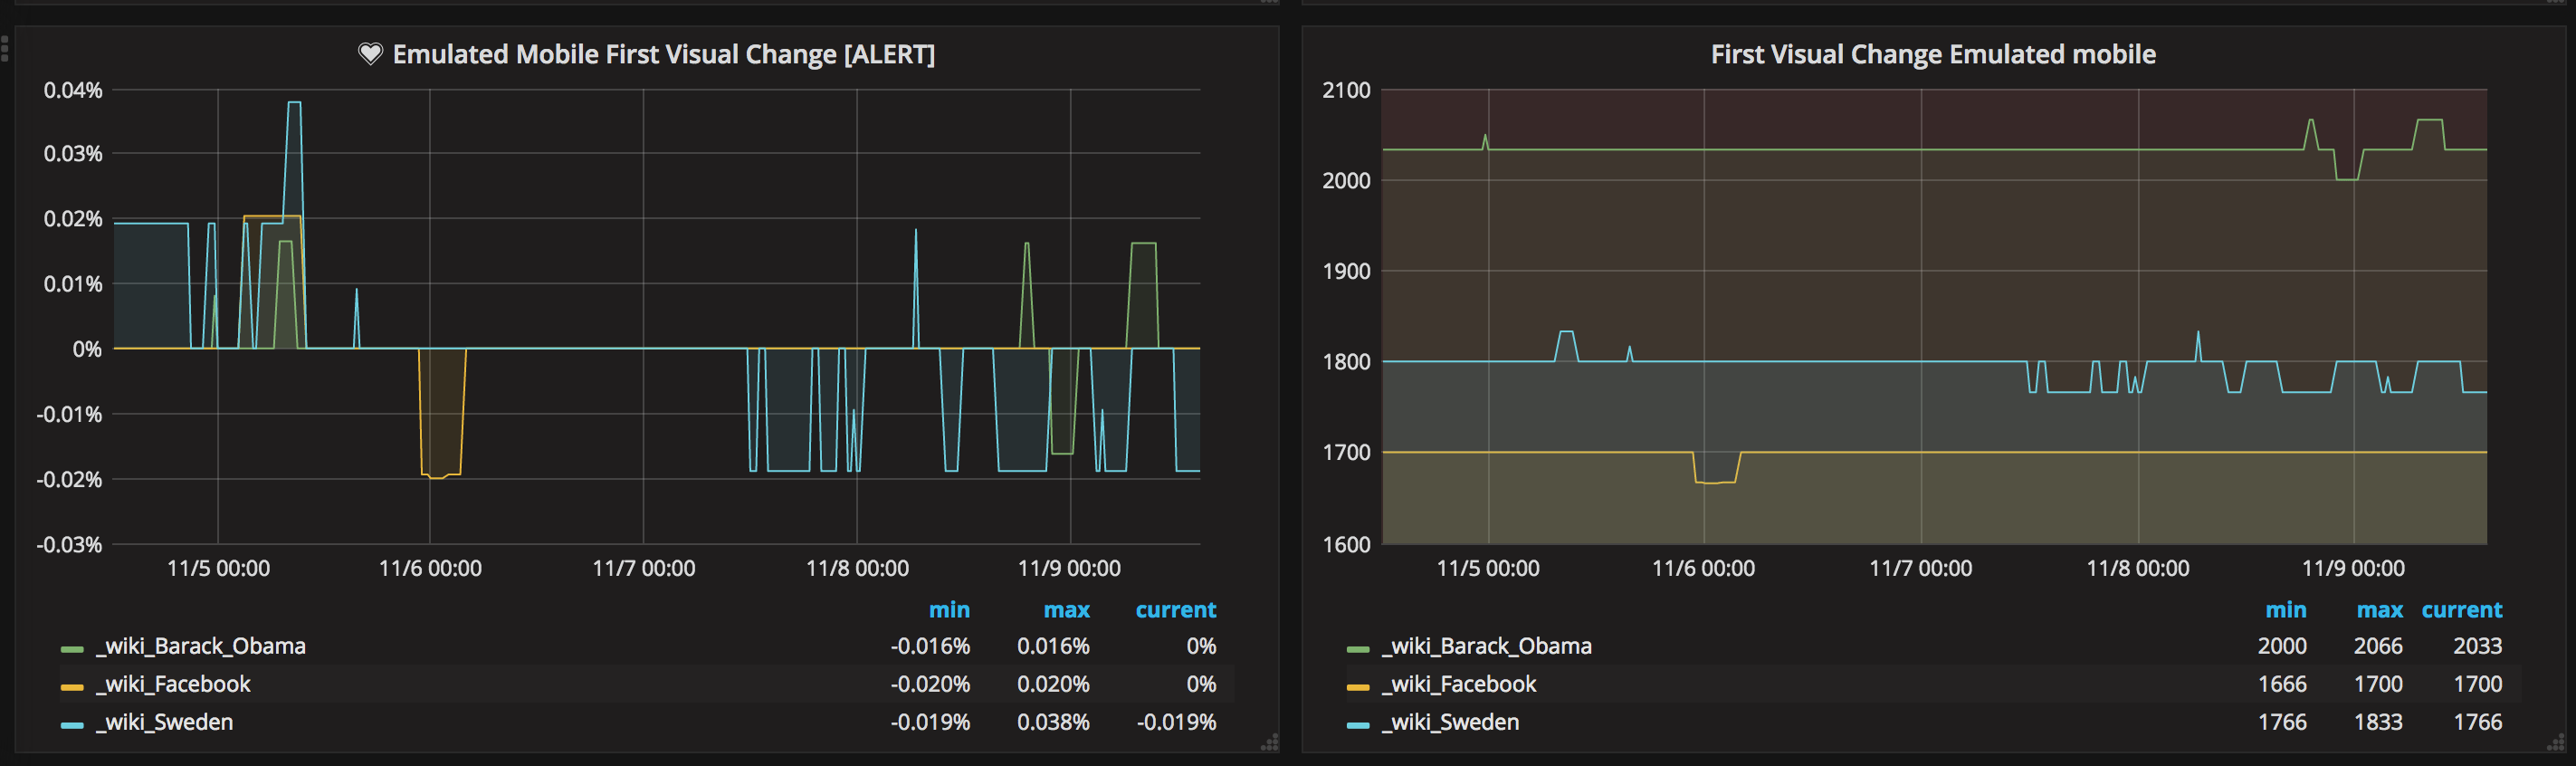
Here we can have alerts on 1% or a diff even smaller.
You can also add alerts for non 200 responses, changes in size/number or requests or whatever fits your needs.
If you have any questions about the alerts, feel free to create an issue at Github or hit us on Slack.