Documentation / Configuration
Sitespeed.io is highly configurable, let’s check it out!
You have the following options when running sitespeed.io within docker (run docker run sitespeedio/sitespeed.io --help to get the list on your command line):
bin/sitespeed.js [options] <url>/<file>

Browser
  --browsertime.browser, -b, --browser                         Choose which Browser to use when you test.  [choices: "chrome", "firefox"] [default: "chrome"]
  --browsertime.iterations, -n                                 How many times you want to test each page  [default: 3]
  --browsertime.connectivity.profile, -c, --connectivity       The connectivity profile.  [choices: "3g", "3gfast", "3gslow", "3gem", "2g", "cable", "native", "custom"] [default: "native"]
  --browsertime.connectivity.downstreamKbps, --downstreamKbps  This option requires --connectivity be set to "custom".
  --browsertime.connectivity.upstreamKbps, --upstreamKbps      This option requires --connectivity be set to "custom".
  --browsertime.connectivity.latency, --latency                This option requires --connectivity be set to "custom".
  --browsertime.connectivity.engine                            Throttle works on Mac and tc based Linux (it is experimental so please use with care). Use external if you set the connectivity outside of Browsertime. The best way do to this is described in https://github.com/sitespeedio/browsertime#connectivity  [choices: "throttle", "external"] [default: "external"]
  --browsertime.pageCompleteCheck                              Supply a Javascript that decides when the browser is finished loading the page and can start to collect metrics. The Javascript snippet is repeatedly queried to see if page has completed loading (indicated by the script returning true). Use it to fetch timings happening after the loadEventEnd.
  --browsertime.script, --script                               Add custom Javascript that collect metrics and run after the page has finished loading. Note that --script can be passed multiple times if you want to collect multiple metrics. The metrics will automatically be pushed to the summary/detailed summary and each individual page + sent to Graphite/InfluxDB.
  --browsertime.selenium.url                                   Configure the path to the Selenium server when fetching timings using browsers. If not configured the supplied NodeJS/Selenium version is used.
  --browsertime.viewPort                                       The browser view port size WidthxHeight like 400x300  [default: "1366x708"]
  --browsertime.userAgent                                      The full User Agent string, defaults to the User Agent used by the browsertime.browser option.
  --browsertime.preScript, --preScript                         Selenium script(s) to run before you test your URL (use it for login, warm the cache, etc). Note that --preScript can be passed multiple times.
  --browsertime.postScript, --postScript                       Selenium script(s) to run after you test your URL (use it for logout etc). Note that --postScript can be passed multiple times.
  --browsertime.delay                                          Delay between runs, in milliseconds. Use it if your web server needs to rest between runs :)
  --browsertime.speedIndex, --speedIndex                       Calculate SpeedIndex. Requires FFMpeg and python dependencies  [boolean]
  --browsertime.video, --video                                 Record a video. Requires FFMpeg to be installed  [boolean]
  --browsertime.videoParams.framerate, --fps                   Frames per second in the video  [default: 30]
  --browsertime.videoParams.crf                                Constant rate factor for the end result video, see https://trac.ffmpeg.org/wiki/Encode/H.264#crf  [default: 23]
  --browsertime.videoParams.addTimer                           Add timer and metrics to the video  [boolean] [default: true]
  --browsertime.userTimingWhitelist, --userTimingWhitelist     This option takes a regex that will whitelist which userTimings to capture in the results. All userTimings are captured by default. T
  --browsertime.firefox.preference                             Extra command line arguments to pass Firefox preferences by the format key:value To add multiple preferences, repeat --browsertime.firefox.preference once per argument.
  --browsertime.firefox.includeResponseBodies                  Include response bodies in HAR when using Firefox.  [boolean]
  --browsertime.chrome.args                                    Extra command line arguments to pass to the Chrome process. Always leave out the starting -- (--no-sandbox will be no-sandbox). To add multiple arguments to Chrome, repeat --browsertime.chrome.args once per argument.
  --browsertime.chrome.collectTracingEvents                    Collect Chromes traceCategories  [boolean]
  --browsertime.chrome.android.package                         Run Chrome on your Android device. Set to com.android.chrome for default Chrome version. You need to run adb start-server before you start.
  --browsertime.chrome.android.deviceSerial                    Choose which device to use. If you do not set it, the first found device will be used.
  --browsertime.chrome.collectNetLog                           Collect network log from Chrome and save to disk.  [boolean]
  --browsertime.chrome.traceCategories                         Set the trace categories.  [string]
  --browsertime.requestheader, -r                              Request header that will be added to the request. Add multiple instances to add multiple request headers.
  --browsertime.block                                          Domain to block. Add multiple instances to add multiple domains that will be blocked.
  --browsertime.basicAuth, --basicAuth                         Use it if your server is behind Basic Auth. Format: username@password.

proxy
  --browsertime.proxy.http   Http proxy (host:port)  [string]
  --browsertime.proxy.https  Https proxy (host:port)  [string]

Crawler
  --crawler.depth, -d     How deep to crawl (1=only one page, 2=include links from first page, etc.)
  --crawler.maxPages, -m  The max number of pages to test. Default is no limit.

Graphite
  --graphite.host                The Graphite host used to store captured metrics.
  --graphite.port                The Graphite port used to store captured metrics.  [default: 2003]
  --graphite.auth                The Graphite user and password used for authentication. Format: user:password
  --graphite.httpPort            The Graphite port used to access the user interface and send annotations event  [default: 8080]
  --graphite.webHost             The graphite-web host. If not specified graphite.host will be used.
  --graphite.namespace           The namespace key added to all captured metrics.  [default: "sitespeed_io.default"]
  --graphite.includeQueryParams  Whether to include query parameters from the URL in the Graphite keys or not  [boolean] [default: false]
  --graphite.arrayTags           Send the tags as Array or a String. In Graphite 1.0 the tags is a array. Before a String  [boolean] [default: true]

Plugins
  --plugins.list    List all configured plugins in the log.  [boolean]
  --plugins.add     Extra plugins that you want to run. Relative or absolute path to the plugin. Specify multiple plugin names separated by comma, or repeat the --plugins.add option
  --plugins.remove  Extra plugins that you want to run. Relative or absolute path to the plugin. Specify multiple plugin names separated by comma, or repeat the --plugins.remove option

Budget
  --budget.configPath  Path to the JSON budget file.
  --budget.config      The JSON budget config as a string.
  --budget.output      The output format of the budget.  [choices: "junit", "tap"]

InfluxDB
  --influxdb.protocol            The protocol used to store connect to the InfluxDB host.  [default: "http"]
  --influxdb.host                The InfluxDB host used to store captured metrics.
  --influxdb.port                The InfluxDB port used to store captured metrics.  [default: 8086]
  --influxdb.username            The InfluxDB username for your InfluxDB instance.
  --influxdb.password            The InfluxDB password for your InfluxDB instance.
  --influxdb.database            The database name used to store captured metrics.  [default: "sitespeed"]
  --influxdb.tags                A comma separated list of tags and values added to each metric  [default: "category=default"]
  --influxdb.includeQueryParams  Whether to include query parameters from the URL in the InfluxDB keys or not  [boolean] [default: false]

Metrics
  --metrics.list        List all possible metrics in the data folder (metrics.txt).  [boolean] [default: false]
  --metrics.filterList  List all configured filters for metrics in the data folder (configuredMetrics.txt)  [boolean] [default: false]
  --metrics.filter      Add/change/remove filters for metrics. If you want to send all metrics, use: *+ . If you want to remove all current metrics and send only the coach score: *- coach.summary.score.*  [array]

WebPageTest
  --webpagetest.host               The domain of your WebPageTest instance.  [default: "https://www.webpagetest.org"]
  --webpagetest.key                The API key for you WebPageTest instance.
  --webpagetest.location           The location for the test  [default: "Dulles:Chrome"]
  --webpagetest.connectivity       The connectivity for the test.  [default: "Cable"]
  --webpagetest.runs               The number of runs per URL.  [default: 3]
  --webpagetest.custom             Execute arbitrary Javascript at the end of a test to collect custom metrics.
  --webpagetest.file               Path to a script file
  --webpagetest.script             The WebPageTest script as a string.
  --webpagetest.includeRepeatView  Do repeat or single views  [boolean] [default: false]
  --webpagetest.private            Wanna keep the runs private or not  [boolean] [default: true]

Slack
  --slack.hookUrl       WebHook url for the Slack team (check https://<your team>.slack.com/apps/manage/custom-integrations).
  --slack.userName      User name to use when posting status to Slack.  [default: "Sitespeed.io"]
  --slack.channel       The slack channel without the # (if something else than the default channel for your hook).
  --slack.type          Send summary for a run, metrics from all URLs, only on errors or all to Slack.  [choices: "summary", "url", "error", "all"] [default: "all"]
  --slack.limitWarning  The limit to get a warning in Slack using the limitMetric  [default: 90]
  --slack.limitError    The limit to get a error in Slack using the limitMetric  [default: 80]
  --slack.limitMetric   The metric that will be used to set warning/error  [choices: "coachScore", "speedIndex", "firstVisualChange"] [default: "coachScore"]

s3
  --s3.key                The S3 key
  --s3.secret             The S3 secret
  --s3.bucketname         Name of the S3 bucket
  --s3.path               Override the default folder path in the bucket where the results are uploaded. By default it's "DOMAIN_OR_FILENAME/TIMESTAMP", or the name of the folder if --outputFolder is specified.
  --s3.region             The S3 region. Optional depending on your settings.
  --s3.removeLocalResult  Remove all the local result files after they have been uploaded to S3  [boolean] [default: false]

HTML
  --html.showAllWaterfallSummary  Set to true to show all waterfalls on page summary HTML report  [boolean] [default: false]
  --html.fetchHARFiles            Set to true to load HAR files using fetch instead of including them in the HTML. Turn this on if serve your pages using a server.  [boolean] [default: false]
  --html.logDownloadLink          Adds a link in the HTML so you easily can download the logs from the sitespeed.io run. If your server is public, be careful so you don't log passwords etc  [boolean] [default: false]
  --html.topListSize              Maximum number of assets to include in each toplist in the toplist tab  [default: 10]

text
  --summary         Show brief text summary to stdout  [boolean] [default: false]
  --summary-detail  Show longer text summary to stdout  [boolean] [default: false]

Options:
  --version, -V    Show version number  [boolean]
  --debug          Debug mode logs all internal messages to the console.  [boolean] [default: false]
  --verbose, -v    Verbose mode prints progress messages to the console. Enter up to three times (-vvv) to increase the level of detail.  [count]
  --mobile         Access pages as mobile a fake mobile device. Set UA and width/height. For Chrome it will use device Apple iPhone 6.  [boolean] [default: false]
  --resultBaseURL  The base URL to the server serving the HTML result. In the format of https://result.sitespeed.io
  --gzipHAR        Compress the HAR files with GZIP.  [boolean] [default: false]
  --outputFolder   The folder where the result will be stored.
  --firstParty     A regex running against each request and categorize it as first vs third party URL. (ex: ".*sitespeed.*")
  --utc            Use Coordinated Universal Time for timestamps  [boolean] [default: false]
  --config         Path to JSON config file
  --help, -h       Show help  [boolean]

Read the docs at https://www.sitespeed.io/documentation/sitespeed.io/
You can analyse a site either by crawling or by feeding sitespeed.io with a list of URLs you want to analyse.
The simplest way to run sitespeed.io is to give it a URL:
docker run --shm-size=1g --rm -v "$(pwd)":/sitespeed.io sitespeedio/sitespeed.io https://www.sitespeed.io
If you want to test multiple URLs, just feed them:
docker run --shm-size=1g --rm -v "$(pwd)":/sitespeed.io sitespeedio/sitespeed.io https://www.sitespeed.io https://www.sitespeed.io/documentation/
You can also use a plain text file with one URL on each line. Create a file called urls.txt:
http://www.yoursite.com/path/
http://www.yoursite.com/my/really/important/page/
http://www.yoursite.com/where/we/are/
Another feature of the plain text file is you can add aliases to the urls.txt file after each URL. To do this, add a non-spaced string after each URL that you would like to alias:
http://www.yoursite.com/ Start_page
http://www.yoursite.com/my/really/important/page/ Important_Page
http://www.yoursite.com/where/we/are/ We_are
Note: Spaces are used to delimit between the URL and the alias, which is why the alias cannot contain one.
Aliases are great in combination with sending metrics to a TSDB (such as Graphite) for shortening the key sent, to make them more user friendly and readable.
And run it:
docker run --shm-size=1g --rm -v "$(pwd)":/sitespeed.io sitespeedio/sitespeed.io urls.txt
If you want to find pages that are not so performant it’s a good idea to crawl. Sitespeed.io will start with the URL and fetch all links on that page and continue to dig deeper into the site structure. You can choose how deep to crawl (1=only one page, 2=include links from first page, etc.):
docker run --shm-size=1g --rm -v "$(pwd)":/sitespeed.io sitespeedio/sitespeed.io https://www.sitespeed.io -d 2
When collecting timing metrics, it’s good to test the URL more than one time (default is three times). You can configure how many runs like this (five runs):
docker run --shm-size=1g --rm -v "$(pwd)":/sitespeed.io sitespeedio/sitespeed.io https://www.sitespeed.io -n 5
Choose which browser to use (default is Chrome):
docker run --shm-size=1g --rm -v "$(pwd)":/sitespeed.io sitespeedio/sitespeed.io https://www.sitespeed.io -b firefox
You should throttle the connection when you are fetching metrics. We have a special section on how you emulate connectivity for real users.
You can set the viewport & user agent, so you can fake testing a site as a mobile device.
The simplest way is to just add --mobile as a parameter. The viewport will be set to 360x640 and the user agent will be Iphone6. If you use Chrome it will use the preset Apple iPhone 6 device.
docker run --shm-size=1g --rm -v "$(pwd)":/sitespeed.io sitespeedio/sitespeed.io https://www.sitespeed.io --mobile
You can also set a specific viewport and user agent:
docker run --shm-size=1g --rm -v "$(pwd)":/sitespeed.io sitespeedio/sitespeed.io https://www.sitespeed.io --browsertime.viewPort 400x400 --browsertime.userAgent "UCWEB/2.0 (MIDP-2.0; U; Adr 4.4.4; en-US; XT1022) U2/1.0.0 UCBrowser/10.6.0.706 U2/1.0.0 Mobile"
Mobile testing is always best on actual mobile devices. You can test on Android phones using sitespeed.io.
In 4.1 we released support for recording a video of the browser screen and use that to calculate visual metrics like Speed Index. This is one of the main benefits for using our Docker images, as it makes for an easy setup. Without Docker, you would need to install all these dependencies first.
If you only care about Speed Index and related metrics (first visual change etc.,) you can run it like this:
docker run --shm-size=1g --rm -v "$(pwd)":/sitespeed.io sitespeedio/sitespeed.io --speedIndex https://www.sitespeed.io/
Sitespeed.io will then analyse the video and then remove it. If you want to keep the video, add the video flag (and you can see it in the Browsertime tab):
docker run --shm-size=1g --rm -v "$(pwd)":/sitespeed.io sitespeedio/sitespeed.io --speedIndex --video https://www.sitespeed.io/
You can categorise requests as first or third parties by adding a regexp. You will then get the size & requests by type both in HTML and sent to Graphite.
docker run --shm-size=1g --rm -v "$(pwd)":/sitespeed.io sitespeedio/sitespeed.io --firstParty ".ryanair.com" https://www.ryanair.com/us/en/
You can change where you want the data to be stored by setting the --outputFolder parameter. That is good in scenarios where you want to change the default behaviour and put the output in a specific location:
docker run --shm-size=1g --rm -v "$(pwd)":/sitespeed.io sitespeedio/sitespeed.io --outputFolder /my/folder ".ryanair.com" https://www.sitespeed.io/
You can keep all your configuration in a JSON file and then pass it on to sitespeed.io, and override with CLI parameters.
Create a config file and call it config.json:
{
  "browsertime": {
    "iterations": 5,
    "browser": "chrome"
  },
  "graphite": {
    "host": "my.graphite.host",
    "namespace": "sitespeed_io.desktopFirstView"
  },
"plugins": {
	"disable": ["html"]
	},
  "utc": true
}
Then, run it like this:
docker run --shm-size=1g --rm -v "$(pwd)":/sitespeed.io sitespeedio/sitespeed.io --config config.json https://www.sitespeed.io
If you want to override and run the same configuration but using Firefox, you just override with the CLI parameter:
docker run --shm-size=1g --rm -v "$(pwd)":/sitespeed.io sitespeedio/sitespeed.io --config config.json -b firefox https://www.sitespeed.io
The CLI will always override the JSON config.
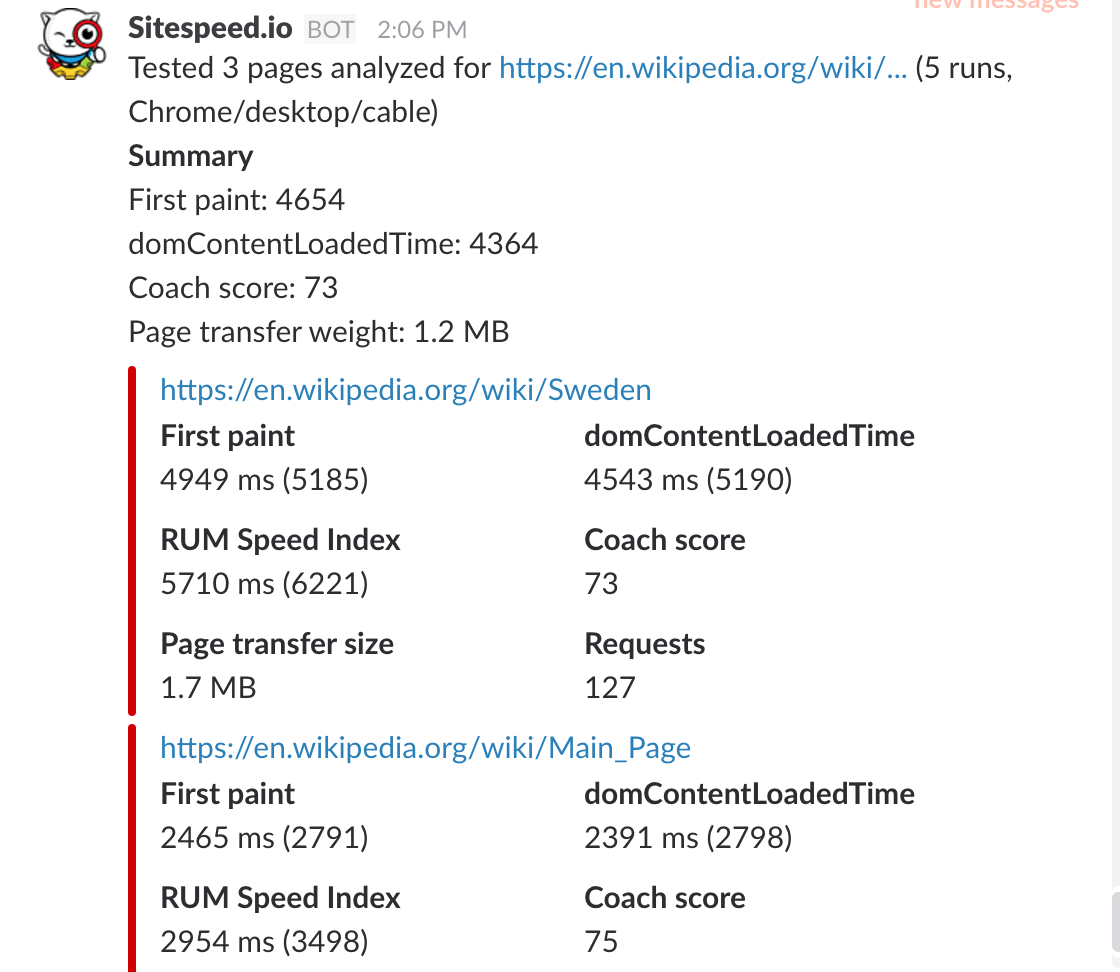
You can send the result of a run to Slack. First, set up a webhook in the Slack API (https://
docker run --shm-size=1g --rm -v "$(pwd)":/sitespeed.io sitespeedio/sitespeed.io https://www.sitespeed.io/ --slack.hookUrl https://hooks.slack.com/services/YOUR/HOOK/URL
You can choose to send just a summary (the summary for all runs), individual runs (with URL), only errors, or everything, by choosing the respective slack.type.
docker run --shm-size=1g --rm -v "$(pwd)":/sitespeed.io sitespeedio/sitespeed.io https://www.sitespeed.io/ --slack.hookUrl https://hooks.slack.com/services/YOUR/HOOK/URL --slack.type summary
We have added a special section for that!