Documentation / Developers
Almost everything we do is written in NodeJS (use latest LTS).
Sitespeed.io uses a lot of other Open Source tools so massive love to those projects and maintainers:
And we also have plugins so that you can use:
And of course we use all the tools in the [sitespeed.io suite]((/sitespeed.io/documentation/).
This is the super simple version, leaving out all other tools that are used:
The big picture looks something like this:
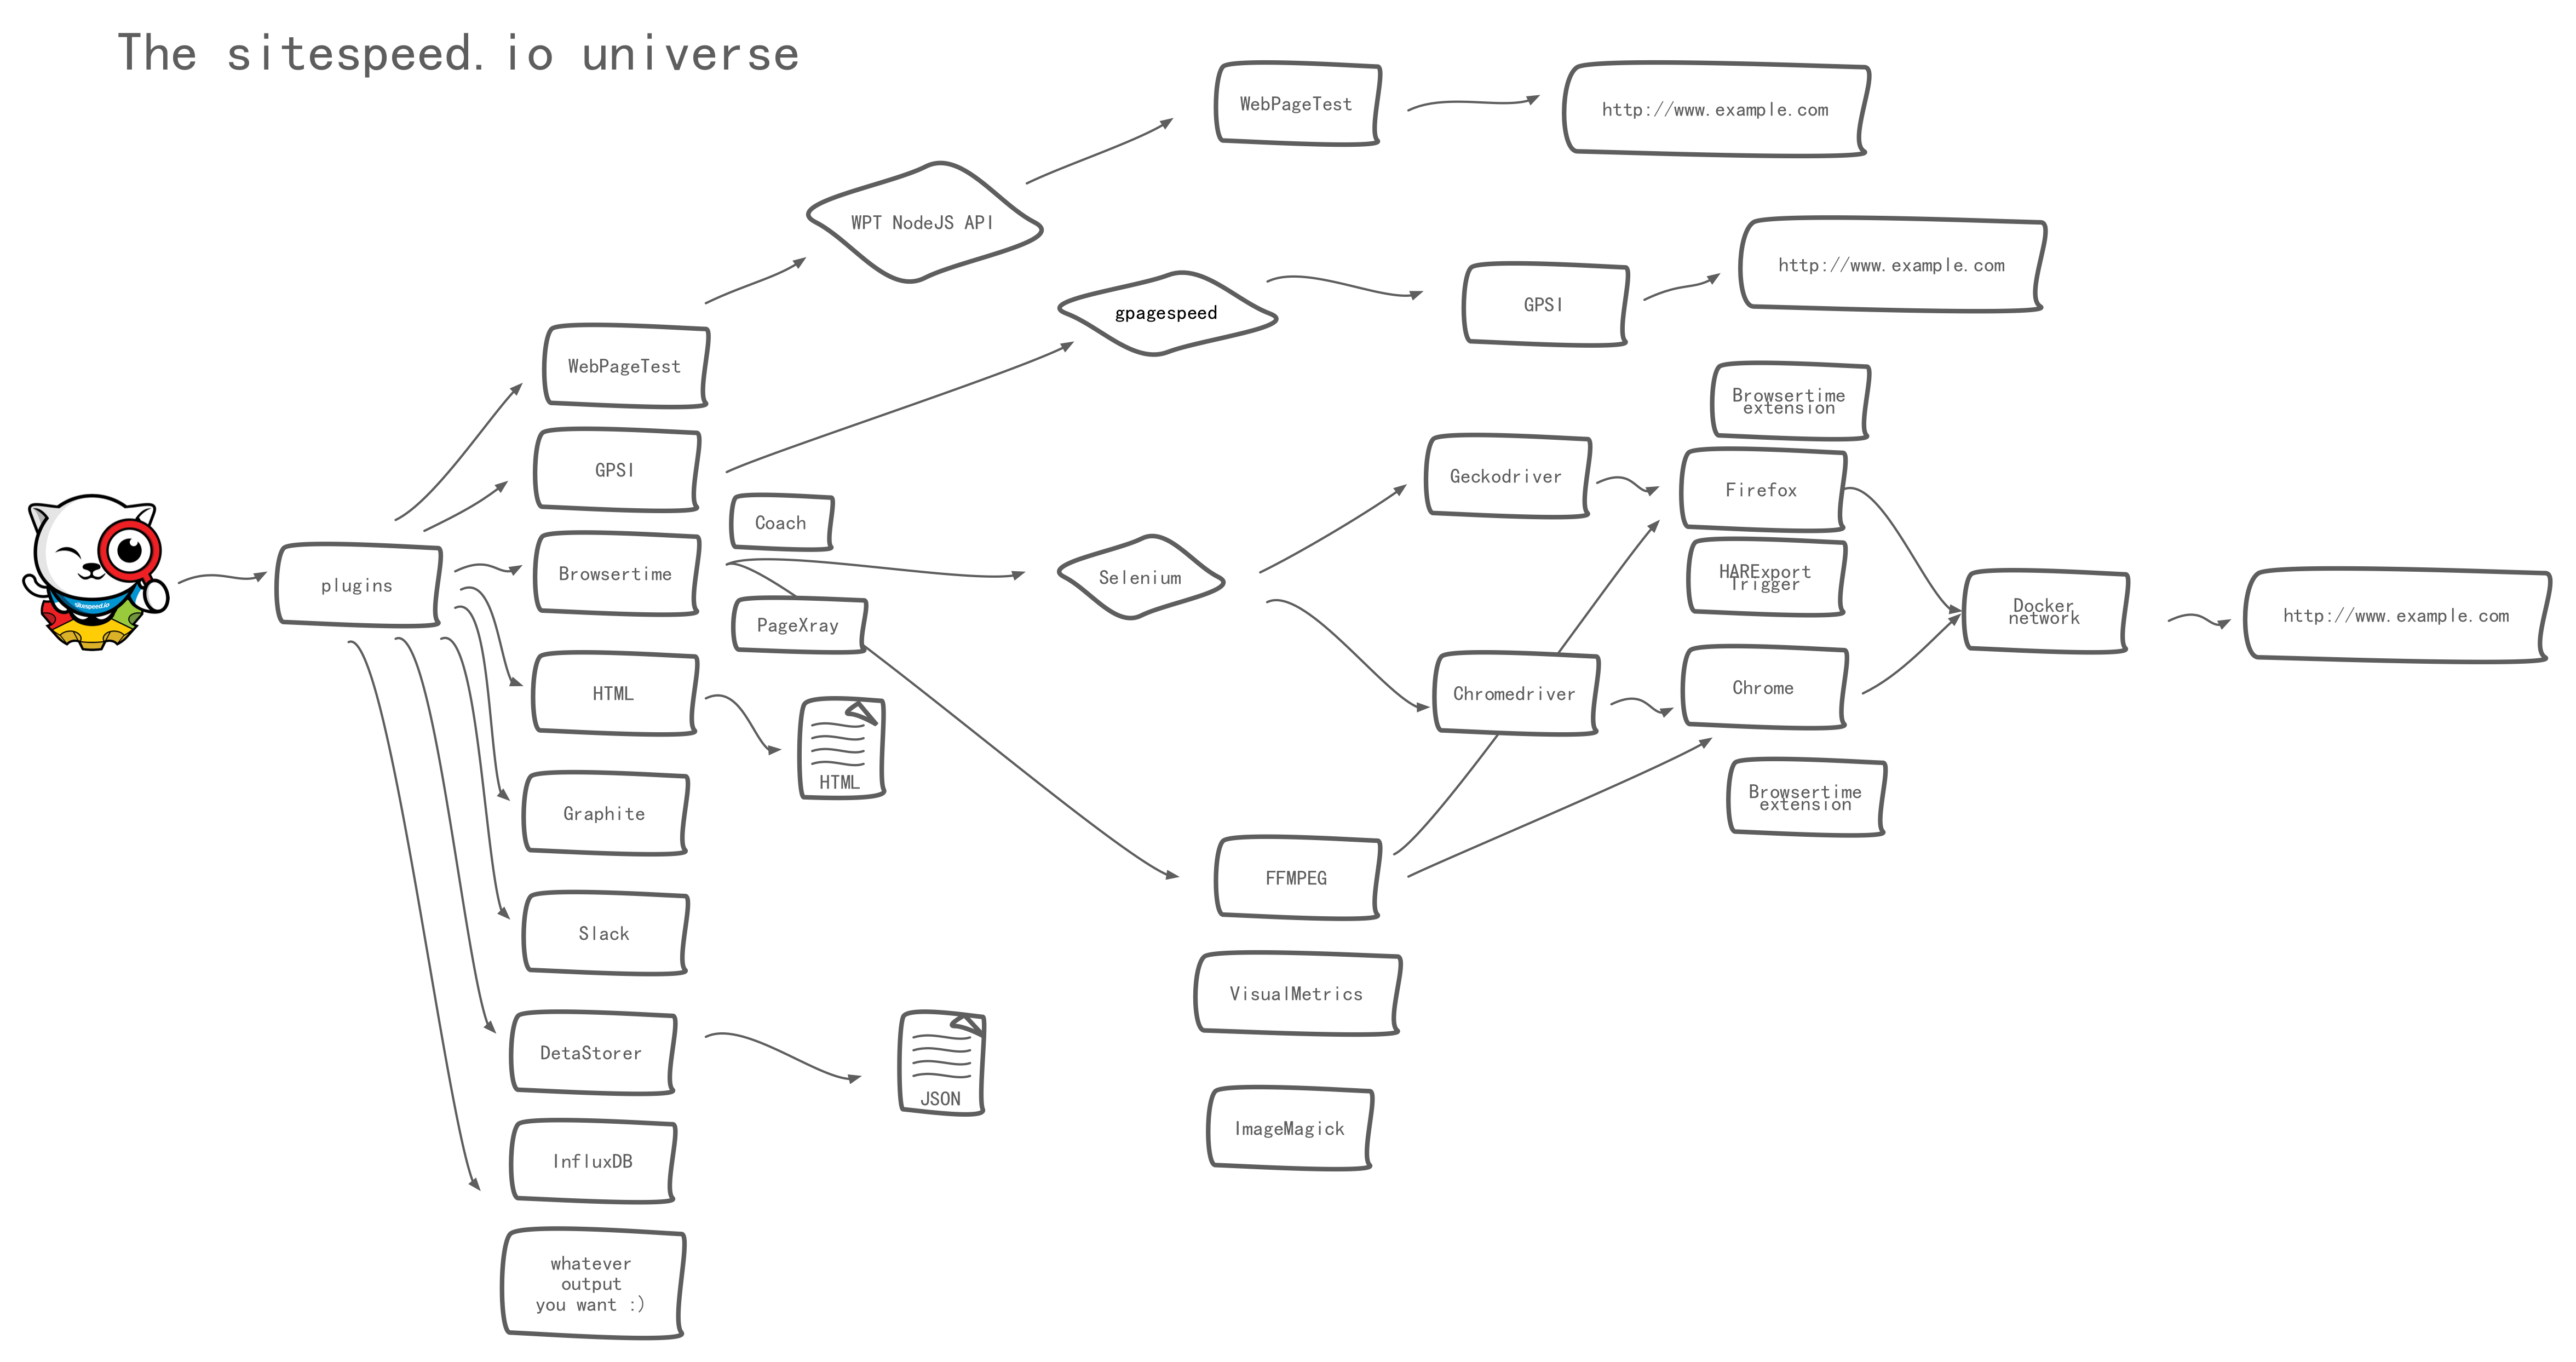
On your local machine you need:
To run the Docker version:
If you want to test and push to Graphite/InfluxDB:
Everything in sitespeed.io (well almost everything) is a plugin. Each plugin will be called, for each message sent in the application and then called when everything is finished.
The plugin structure looks like that.
We use Pug as template for the HTML. If you are use to debug with console.log we have a special feature for you. We pass on JSON to the templates, so if you want to output the data structure in the HTML you can easily do that by just adding:
p #{JSON.stringify(pageInfo)}
Where pageInfo is the data structure that you wanna inspect.
Always make sure your code follow our lint rule by running: npm run lint
If you want to integrate sitespeed.io into your NodeJS application you can checkout how we do that in our Grunt plugin. It’s a great working example. :)
The documention lives in your cloned directory under docs/.
First make sure you have Bundler: gem install bundler
You should upgrade your ruby gems too: gem update --system
If you run on a Mac OS make sure you have xcode-select installed: xcode-select --install
To run the documentation server locally execute the following from within the /docs directory after cloning the repo locally: bundle install && bundle exec jekyll serve --baseurl ''.
Visit http://localhost:4000/ in the browser of your choice.
You can debug sitespeed.io using Chrome and NodeJS > 6. Thanks @moos for sharing.
node --inspect --debug-brk bin/sitespeed.js -m25 -n1 http://0.0.0.0:8082
And you will get something like this:
Debugger listening on port 9229.
Warning: This is an experimental feature and could change at any time.
To start debugging, open the following URL in Chrome:
    chrome-devtools://devtools/remote/serve_file/@62cd277117e6f8ec53e31b1be5829 a6f7ab42ef/inspector.html?experiments=true&v8only=true&ws=localhost:9229/node
Then copy&paste the URL in chrome and you’re in inspect mode. --debug-brk ensures a breakpoint as soon as the code is entered. From there, you can start any of the profiles under the Profile tab.
Use it when you want to debug functionality or check memory usage.